A price chart looks like a single answer to "what is this skin worth", but it is a summary of past sales, and summaries can mislead. Before you trust the line, check what it measures, how many sales sit behind it, and what the market is asking and bidding right now.
What the line actually measures
On the Steam Community Market, the chart on an item page is labelled Median Sale Prices. Each point is the middle price of the sales completed in that period. It isn't the cheapest listing, and it isn't an average that one huge sale could drag around. Since Valve's market update in May 2026, the graph also shows sales volume next to price, so you can see how many trades produced each point.
Third-party sites draw their own charts, and they don't all plot the same thing. Some show the lowest asking price over time, some an average of sales, some a blend of several venues. Read the legend before comparing two charts, because a lowest-ask line and a median-sale line for the same skin can tell different stories.
Sales and listings are different evidence
A listing is an asking price: what one seller hopes to get. A sale is what a buyer actually paid. On a slow-moving item the lowest listing can sit well above recent sales, and anyone can list at an absurd price, so "starting at" numbers are the weakest evidence on the page.
Buy orders are the other side of the market: standing offers from buyers who name the most they will pay. The gap between the highest buy order and the lowest listing is the spread, explained in buy orders vs listings. A narrow spread means buyers and sellers roughly agree. A wide one means the price is still being negotiated, and the chart's last point may not be reachable today.
Keep fees in mind too. Steam's prices include what the buyer pays on top of the seller's share: a 5% Steam transaction fee plus a 10% Counter-Strike 2 fee. A seller therefore nets about 87% of a Steam sale price, which matters as soon as you compare Steam history with a cash marketplace.
Volume tells you how much to trust a number
A median built from hundreds of sales a day is hard to move. A median built from three sales a week can jump because of one buyer, and it can sit flat for days simply because nothing sold. Look at the volume bars under the line before you read meaning into any move.
Volume also separates repricing from noise. A move that comes with a surge in volume means many people traded at the new level. A move on one or two sales means little until more trades confirm it.
| What you see | What it usually means |
|---|---|
| Price up, volume up | Broad buying at higher prices |
| Price up, volume tiny | A few sales; wait for confirmation |
| Price down, volume up | Sellers accepting lower bids |
| Flat line, no volume | No recent sales; the chart is stale |
Outliers and where they come from
Steam groups history by item name and wear, so every Field-Tested copy of a skin lands on the same chart. A copy with a very low float, a sought-after pattern or expensive stickers can sell far above the rest and show up as a spike that says nothing about an ordinary copy. Steam's listings now display float, pattern template and applied stickers and charms, so when a sale looks odd, check what kind of copy is trading at that level.
Some outliers are simple mistakes: a seller typing the wrong price, or someone listing far below the market straight into a waiting buy order. These appear as single dots far from the line and don't repeat.
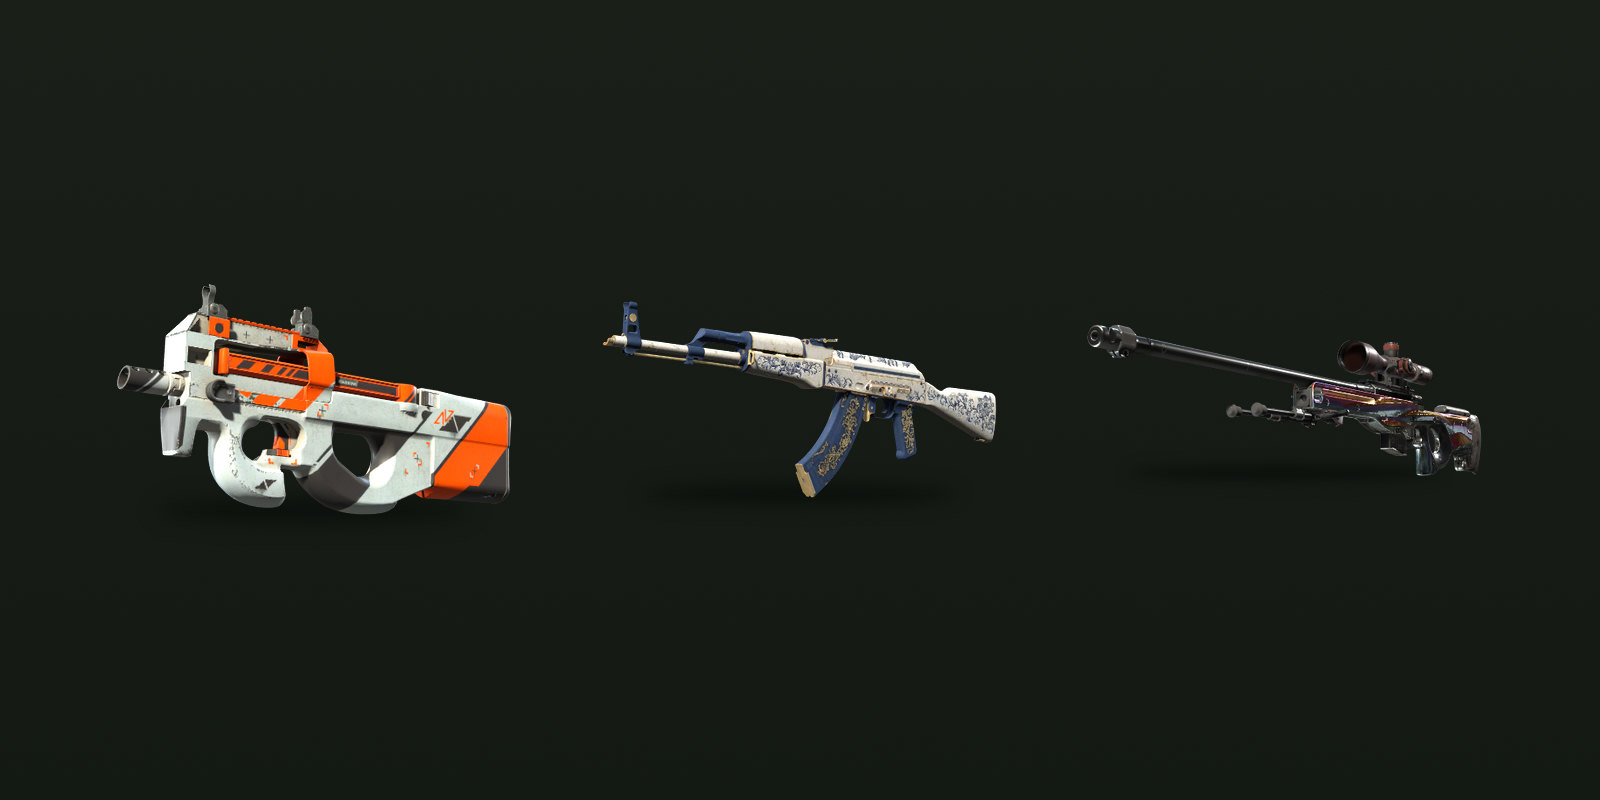
Other jumps are real. After Valve's October 22, 2025 update let five Covert skins be traded up into a knife or gloves, Ars Technica reported that the P90 | Asiimov's median Steam sale price went from $10 to well over $100 within a day. That wasn't noise. A rule change gave every Covert a new use, and the move showed up across many sales at once.
Timing effects that bend the chart
New items don't reach the market right away. Valve's October 2024 patch put a seven-day re-trade and re-sale restriction on items obtained from the in-game store, trade offers and the Steam Community Market. The first week of a brand-new skin's chart is therefore built from very few tradable copies, and the bulk of the supply only shows up after that.
Events leave marks as well: game updates, changes to which cases drop, Major tournaments. When you see a step change in a chart, find out what happened that day before you treat it as a trend. Patch notes on the Counter-Strike Wiki or Steam's news page are the quickest check.
The time window changes the story too. A lifetime chart shows where an item has been; a one-month view is closer to what you can buy or sell it for now. Use the long view for context and the short one for decisions.
A short routine before you trust a price
- Pick a window that fits the question: about a month for current value, a year or more for context.
- Check the volume behind that window. Thin volume means a wide margin of error.
- Compare the recent median with today's lowest listing and highest buy order.
- Look for update dates or other events near any big move.
- If your copy has a notable float, pattern or sticker set, look for sales of similar copies instead of the item's chart.
When you want a second reference while comparing venues, CS2Sell's price pages on Prices are one more data point, and the steps in how to price-check a skin cover the rest of the process.
Sources
- Steam Community Market Updates — Steam News (Valve)
- Community Market FAQ — Steam Support
- AK-47 | Redline (Field-Tested) item page — Steam Community Market
- CS2 item market loses nearly $2B in value overnight due to "trade up" update — Ars Technica
- Counter-Strike 2 patches/October 2, 2024 — Counter-Strike Wiki